Demographic Dashboard (Demographic Overview Report)
The Demographic Dashboard feature provides detailed reports that contain various information including counts by gender, citizenship, age, language, communication modality, mobility, location (state), race, supervision, program, and ID type, as well as Active/Inactive Individuals and Top 10 Diagnoses [ICD-9/ICD 10/DSM-5]. The numbers in the demographic report are linked to the corresponding Individual Demographic form. Users may generate/view the Demographic Information for a single Program or for multiple Programs at the same time.
Users with the Admin Report Administrative Role are able to generate the Demographic Dashboard.
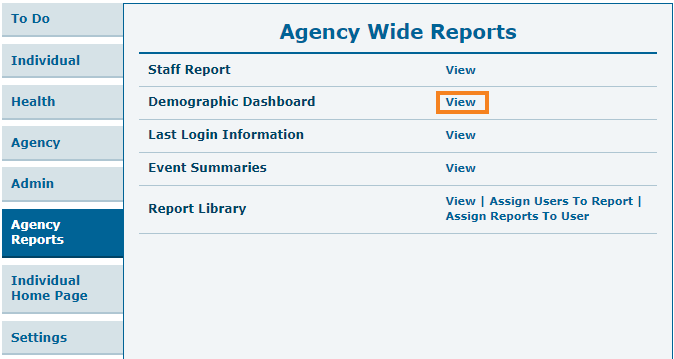
1. Click on the View link next to the Demographic Dashboard section under the Agency Reports tab.
2. In the Select Program(s) For Demographic Dashboard page, select the Programs to generate a Demographic Report by clicking the checkboxes next to the Program names.
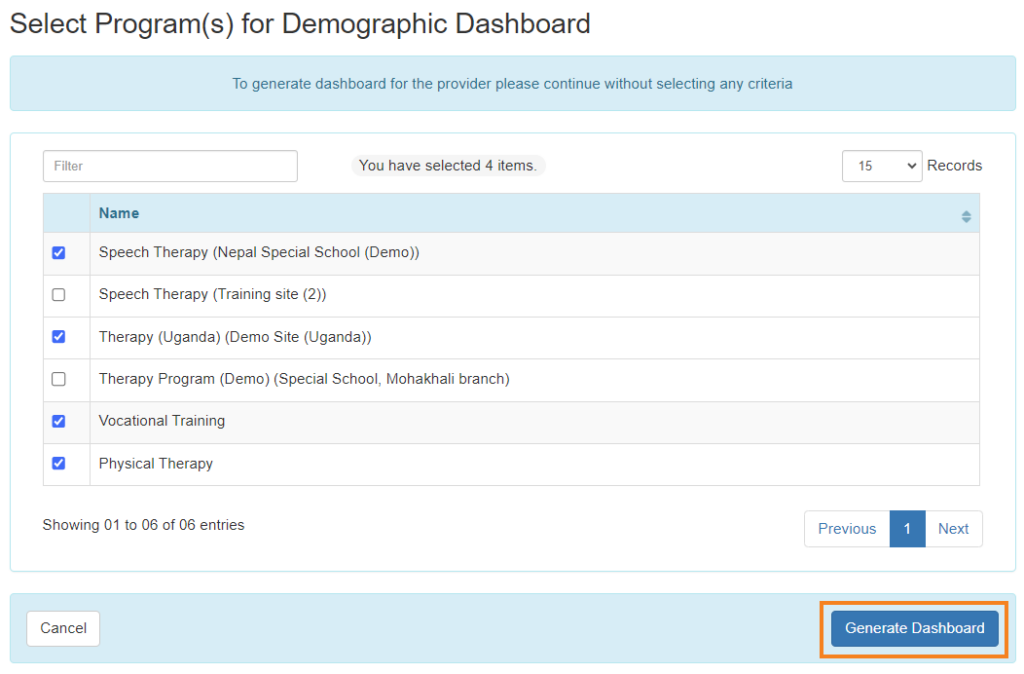
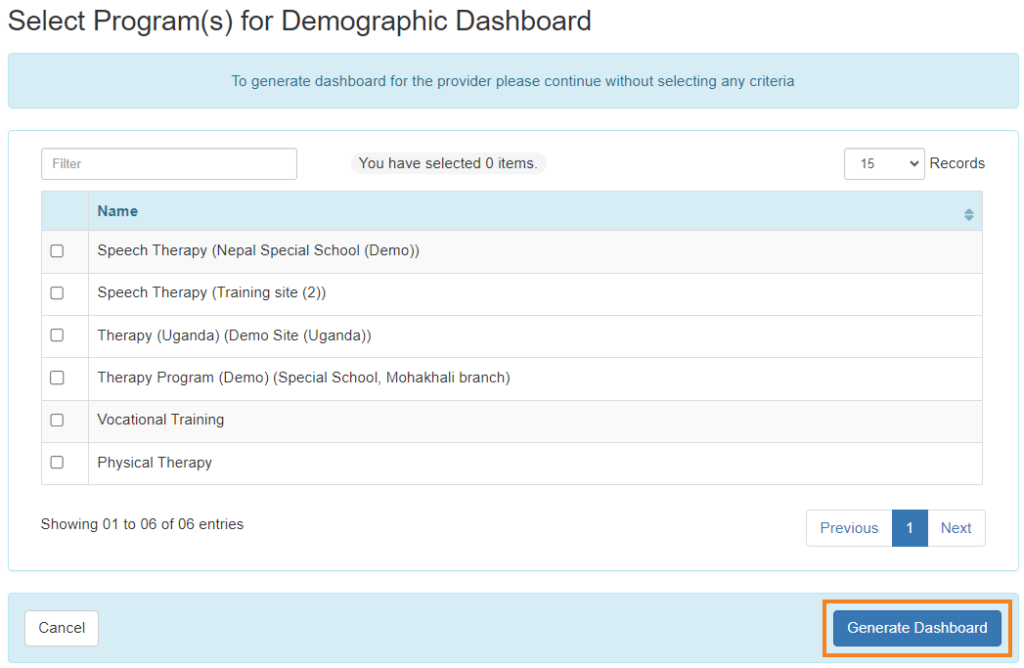
Click on the Generate Report button after selecting the programs.
Users may click on the Generate Report button to generate a Demographic report for all programs. Users may also select one or more programs to generate the Demographic report.
3. Demographic Dashboard page will appear which shows information like Active/Inactive Individual, Age Group, Diagnosis, Communication Modality, Mobility, Supervision etc.
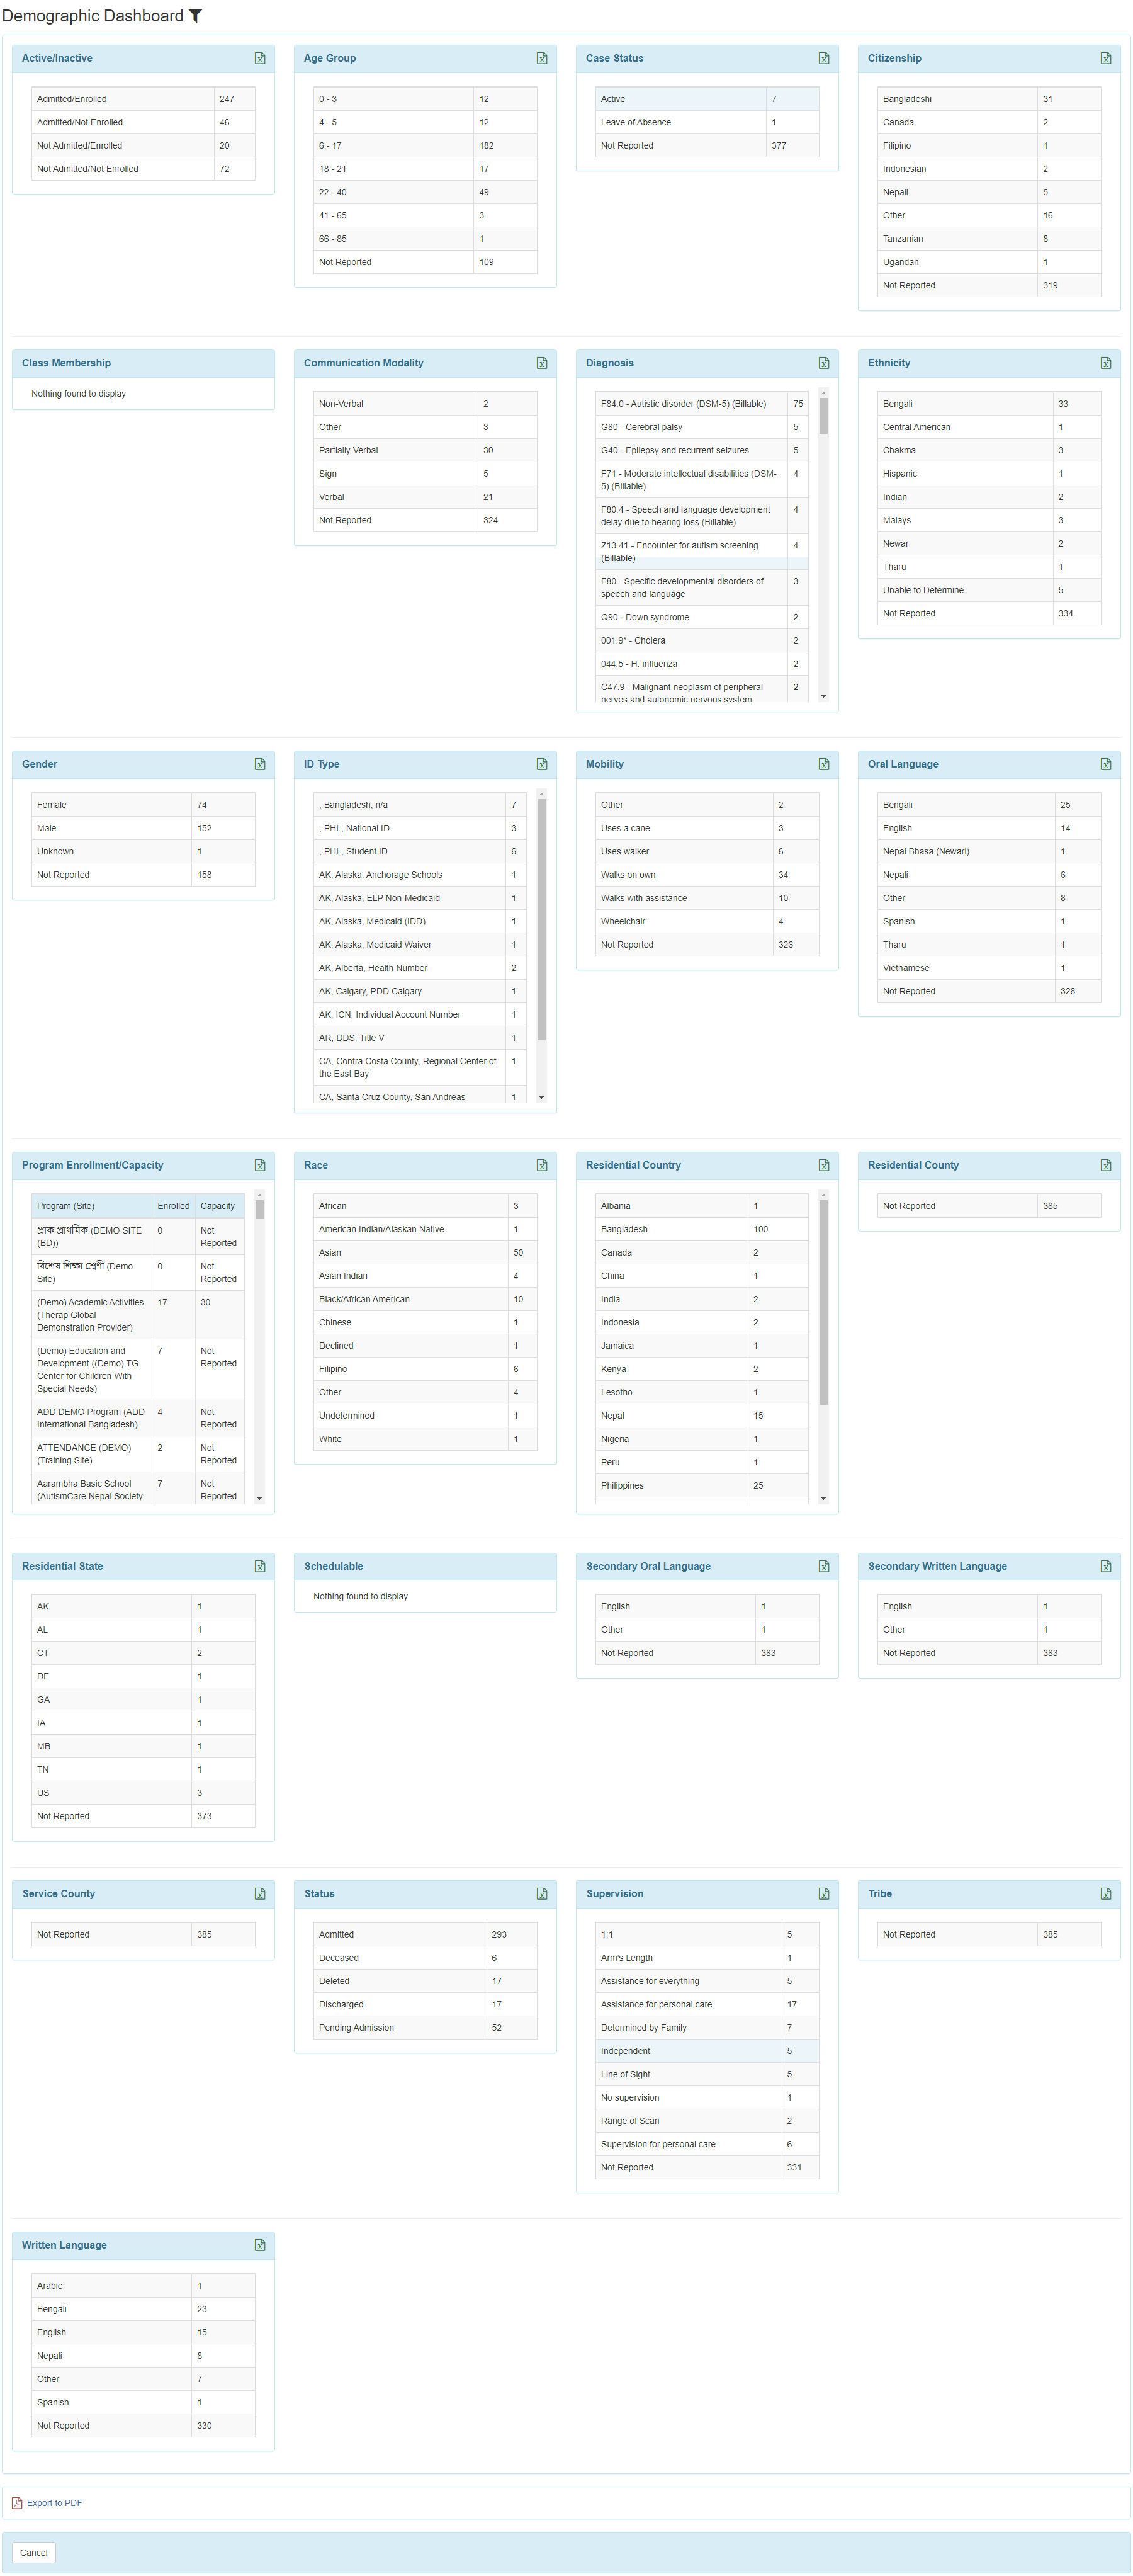
4. Click on the Export to PDF link located at the bottom of the Demographic Dashboard page to download the results to a PDF file.

5. Users may click on the count displayed beside each category to view the list of individuals of that category.
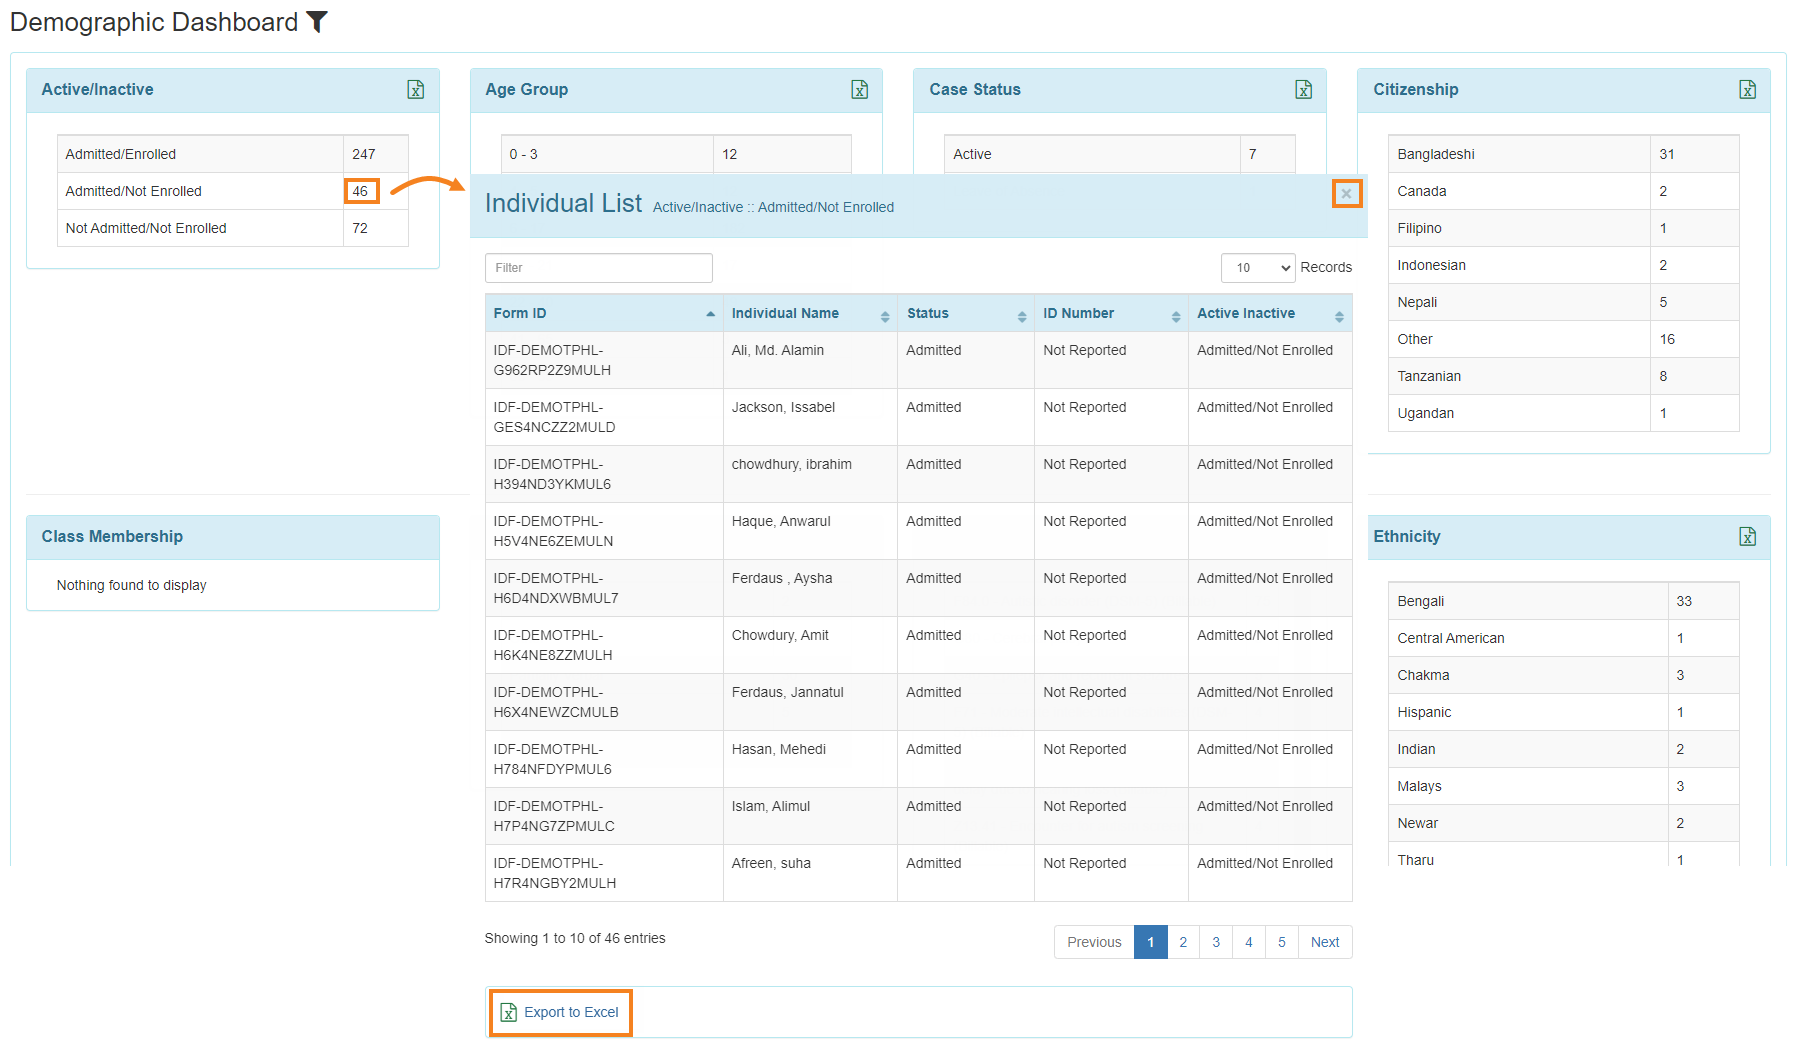
Click on the Export To Excel link to download the result in Excel file. Click on the Close button to close this window.


